Dashboard tour
The dashboard is the secondary surface — the CLI is the source of
truth. You go to the dashboard when you want to browse historical
scans, interactively triage backlog, or show somebody else
what's going on. It is a Next.js app under
frontend/;
all pages talk only to the backend's REST API.
This tour walks the v0.6.0 redesign. The screenshots-in-words below match what you see on a fresh local install.
App shell
Persistent layout, applied to every page (defined in
frontend/src/app/layout.tsx):
- Sidebar (220px, left). Page nav grouped into Scans, Reports, Settings. Collapses to icon strip below 1024px.
- Topbar (56px, sticky). Breadcrumb-style page label (left),
command palette trigger (
⌘K, center), and on the right: notifications bell, API health indicator, theme toggle. - Main content. Page-specific.
The shell is intentionally calm — refined neutrals, single accent color (moss green), no neon. See DESIGN.md for the rules.
Overview (/)
The home page. Layout:
- PageHeader — title "Overview", scan count + scanner count metadata, "New scan" primary action.
- StatLine — running totals: total scans, total findings, critical / high counts, last scan timestamp.
- Latest scan two-column section — the most recent scan's status, target, scanner-chip strip, and severity counts.
- Recent scans compact table — last ~10 rows.
- Compliance coverage cards — one per framework. See Compliance.
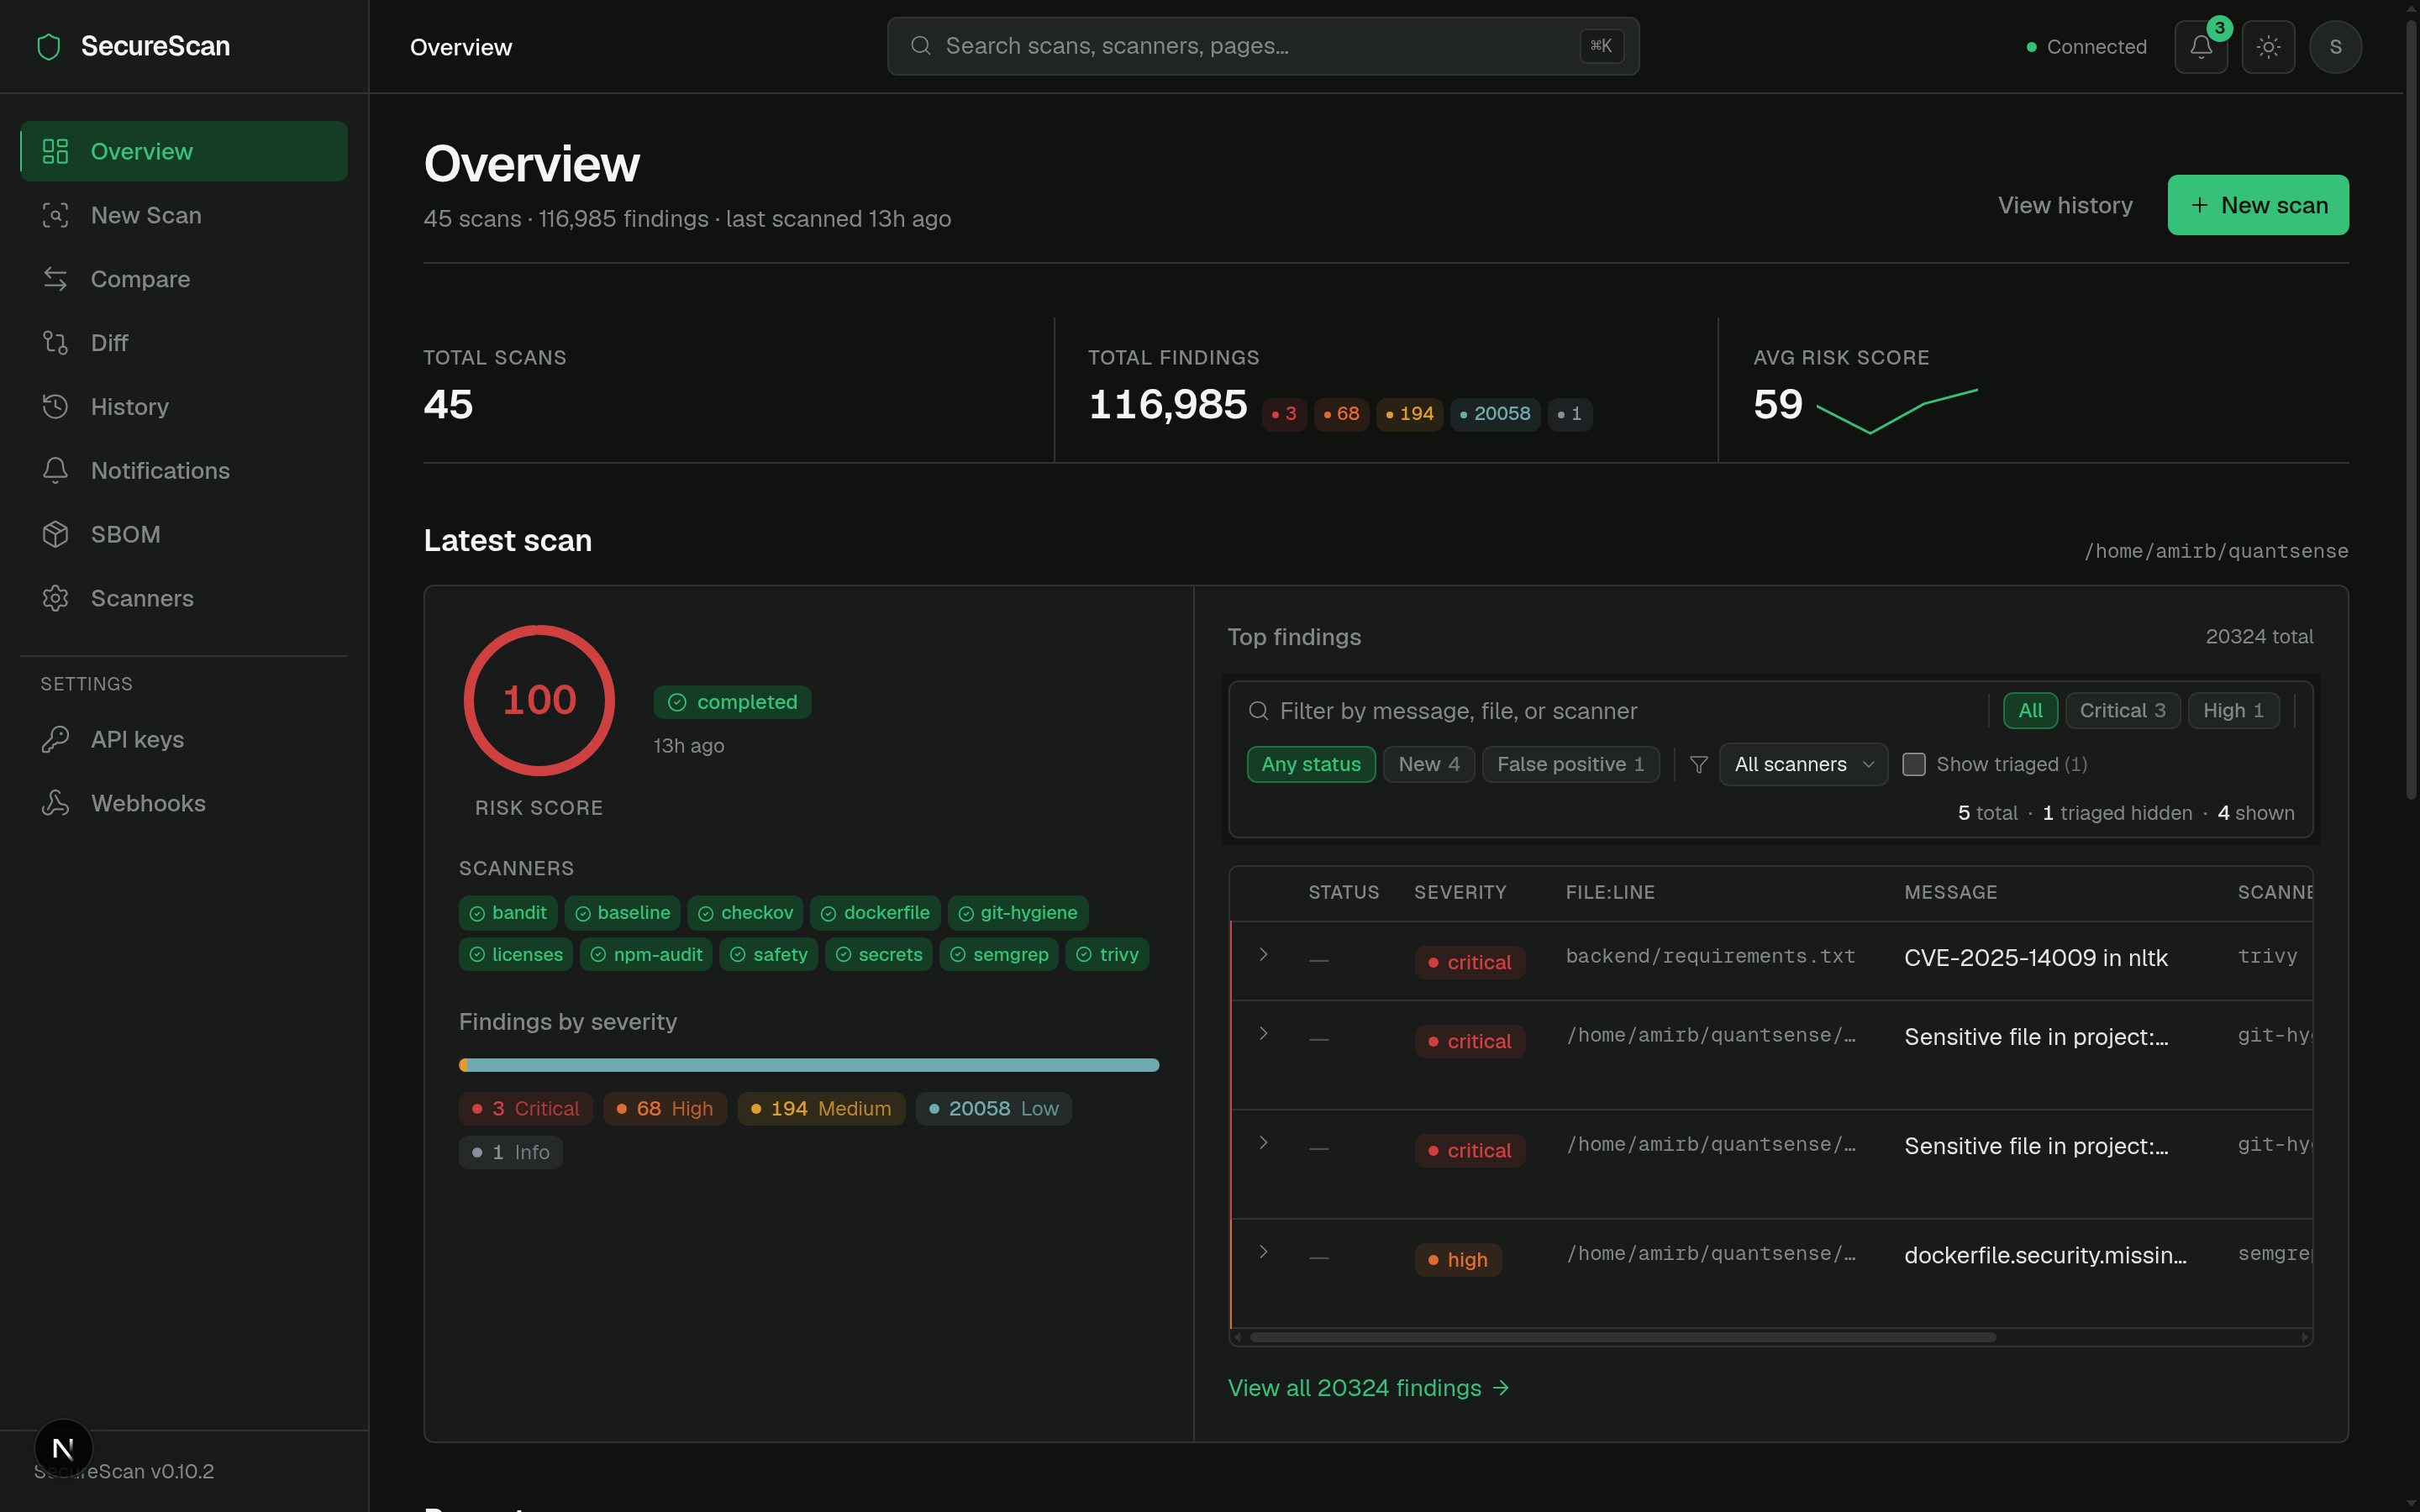
Source: frontend/src/app/page.tsx.
New scan (/scan)
Two-column wizard with a sticky preview panel showing what is about to run.
LEFT (form)                          RIGHT (sticky preview)
─────────────────────────────────    ──────────────────────────
Target path  [browse...]             Will run:
                                       ☑ semgrep
Scan types                             ☑ bandit
  ☑ Code      (4 scanners)             ☑ secrets
  ☐ Dependency (3 scanners)            ☑ git-hygiene
  ☐ IaC       (2 scanners)
  ☐ Baseline  (1 scanner)            Skipped (1)
  ☐ DAST      (URL required)           checkov: pip install checkov
  ☐ Network   (host required)

Quick presets                        Severity threshold
  [code-only]  [dep-only]  [full]      Fail at: high

Recently scanned
  /home/me/proj-a
  /home/me/proj-b                    [ Start scan ]
The page reads GET /api/dashboard/status on mount and disables
categories whose scanners are all unavailable, with inline install
hints. Default selection adapts to availability — a host with no
DAST tools won't pre-tick the DAST checkbox.
Source: frontend/src/app/scan/page.tsx.
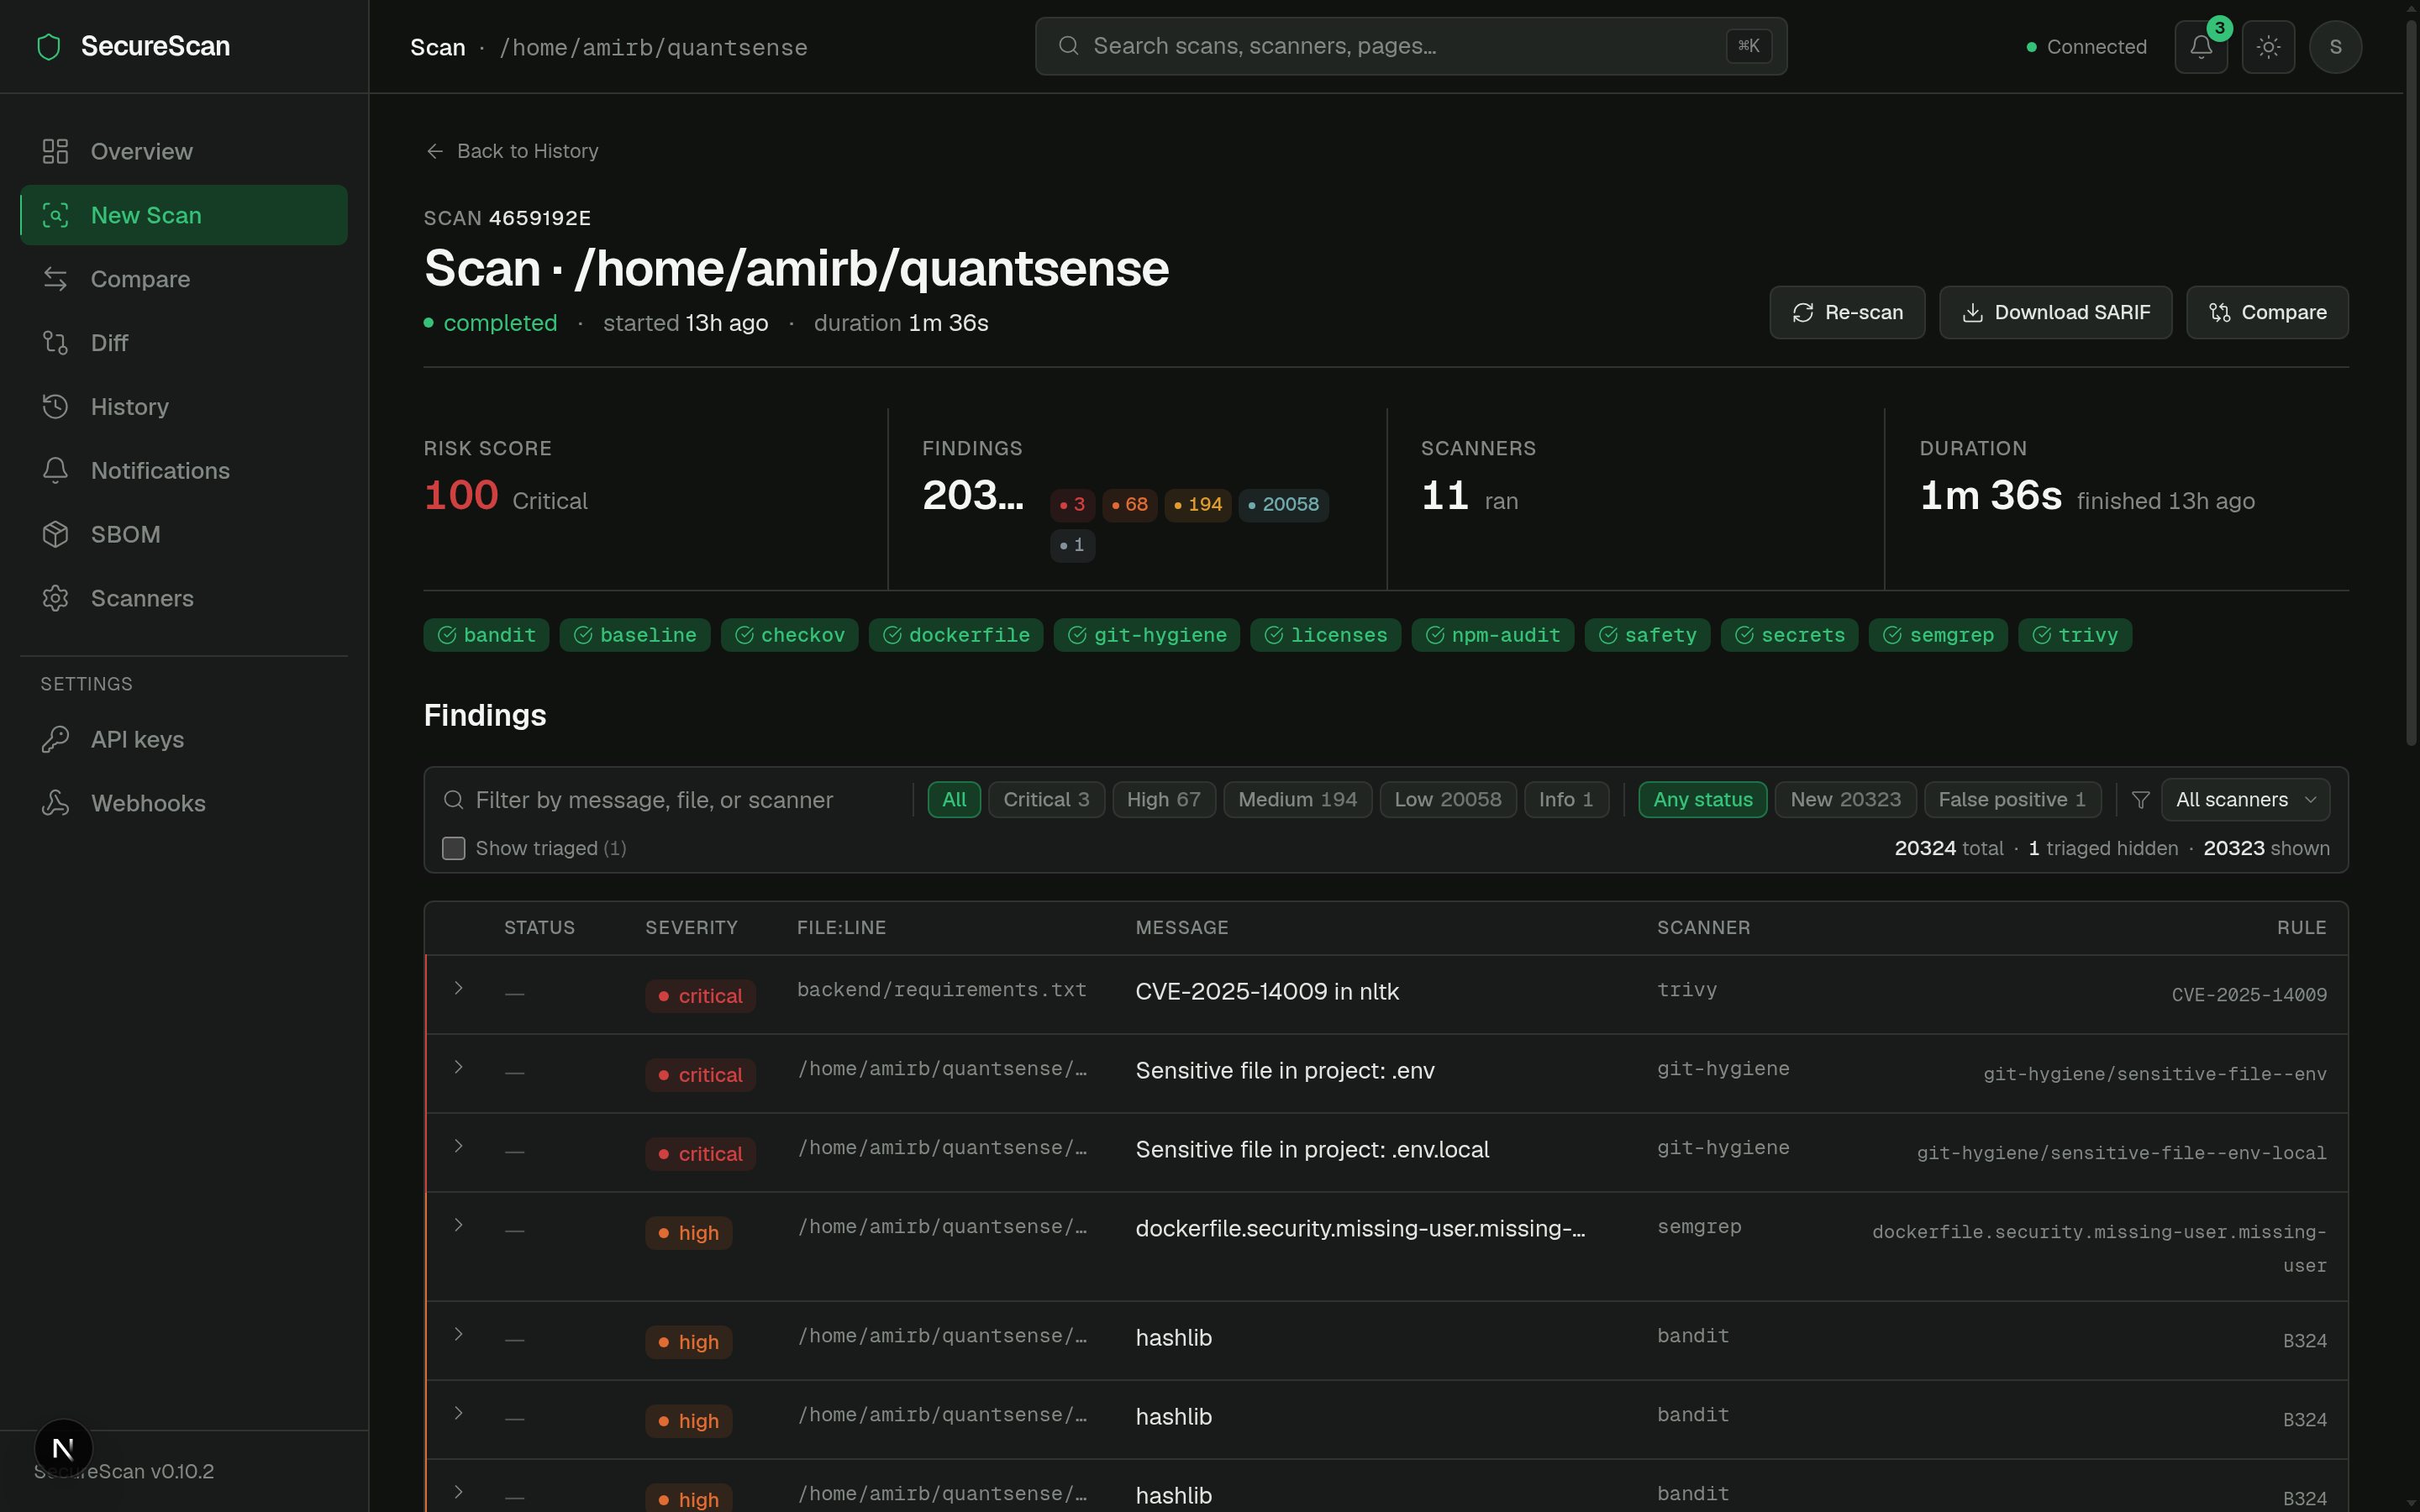
Scan detail (/scan/[id])
The page everybody spends the most time on.
PageHeader
  /home/me/proj-a · scan_id 0f1a93cb · [...] [Cancel] [Re-run] [Delete]

StatLine
  Risk score 34.2 · ●3 critical · ●5 high · ●2 medium · 12 scanners · 1m 22s

ScanProgressPanel  (only while running/pending — v0.7.0 SSE)
  ●semgrep      ✓ complete   124ms    7 findings
  ●bandit       ✓ complete   62ms     3 findings
  ●trivy        running...
  ●safety       queued

Scanner chip strip
  Ran: semgrep · bandit · trivy · safety · secrets   Skipped (1): zap

Sticky filter bar
  Severity: [● critical 3] [● high 5] [● medium 2] [● low 0] [● info 0]
  Status:   [new] [triaged] [false_positive] [accepted_risk] [fixed] [wont_fix]
  [search...]                                              [▼ Show suppressed]

Findings table  (compact, sortable, severity-tinted left edge)
  ┃ ● critical  Use of eval()                  backend/api.py:42       semgrep   ⌃
  ┃ ● critical  SQL injection                  backend/db.py:12        bandit    ⌃
  ┃ ● high      Missing X-Frame-Options        (https://...)           dast      ⌃
  ...
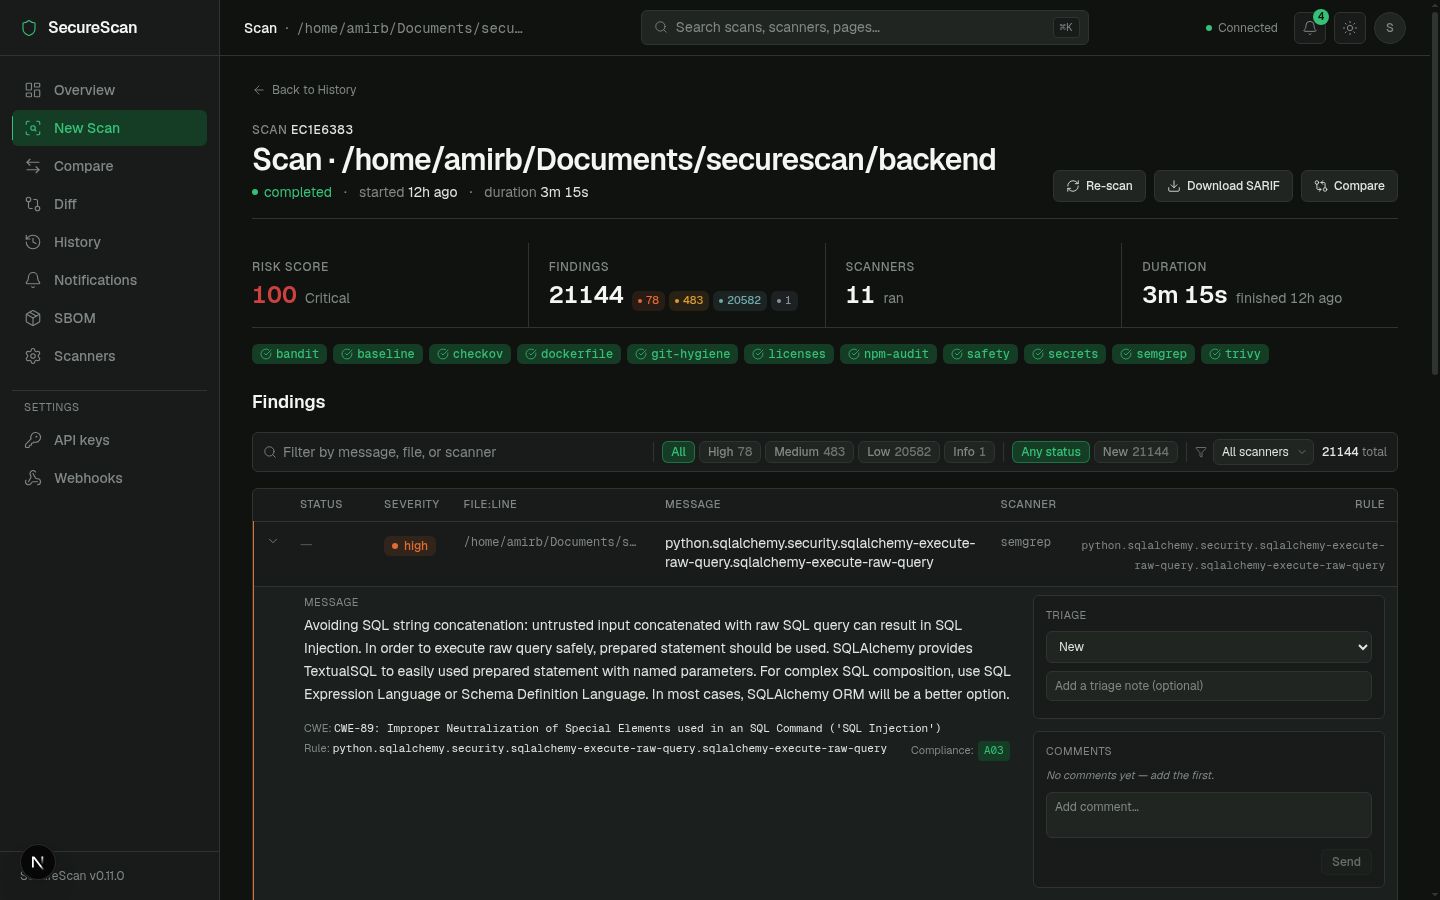
Expand a row to reveal:
- Matched line (mono, 5-line context).
- AI explanation + remediation hint (when
--aiwas on; off by default in CI). - Triage panel — status dropdown + note textarea.
- Comments panel — thread, lazy-loaded.
The live progress panel above the findings table only shows while a
scan is pending or running — it animates from queued → running →
complete per scanner over Server-Sent Events:
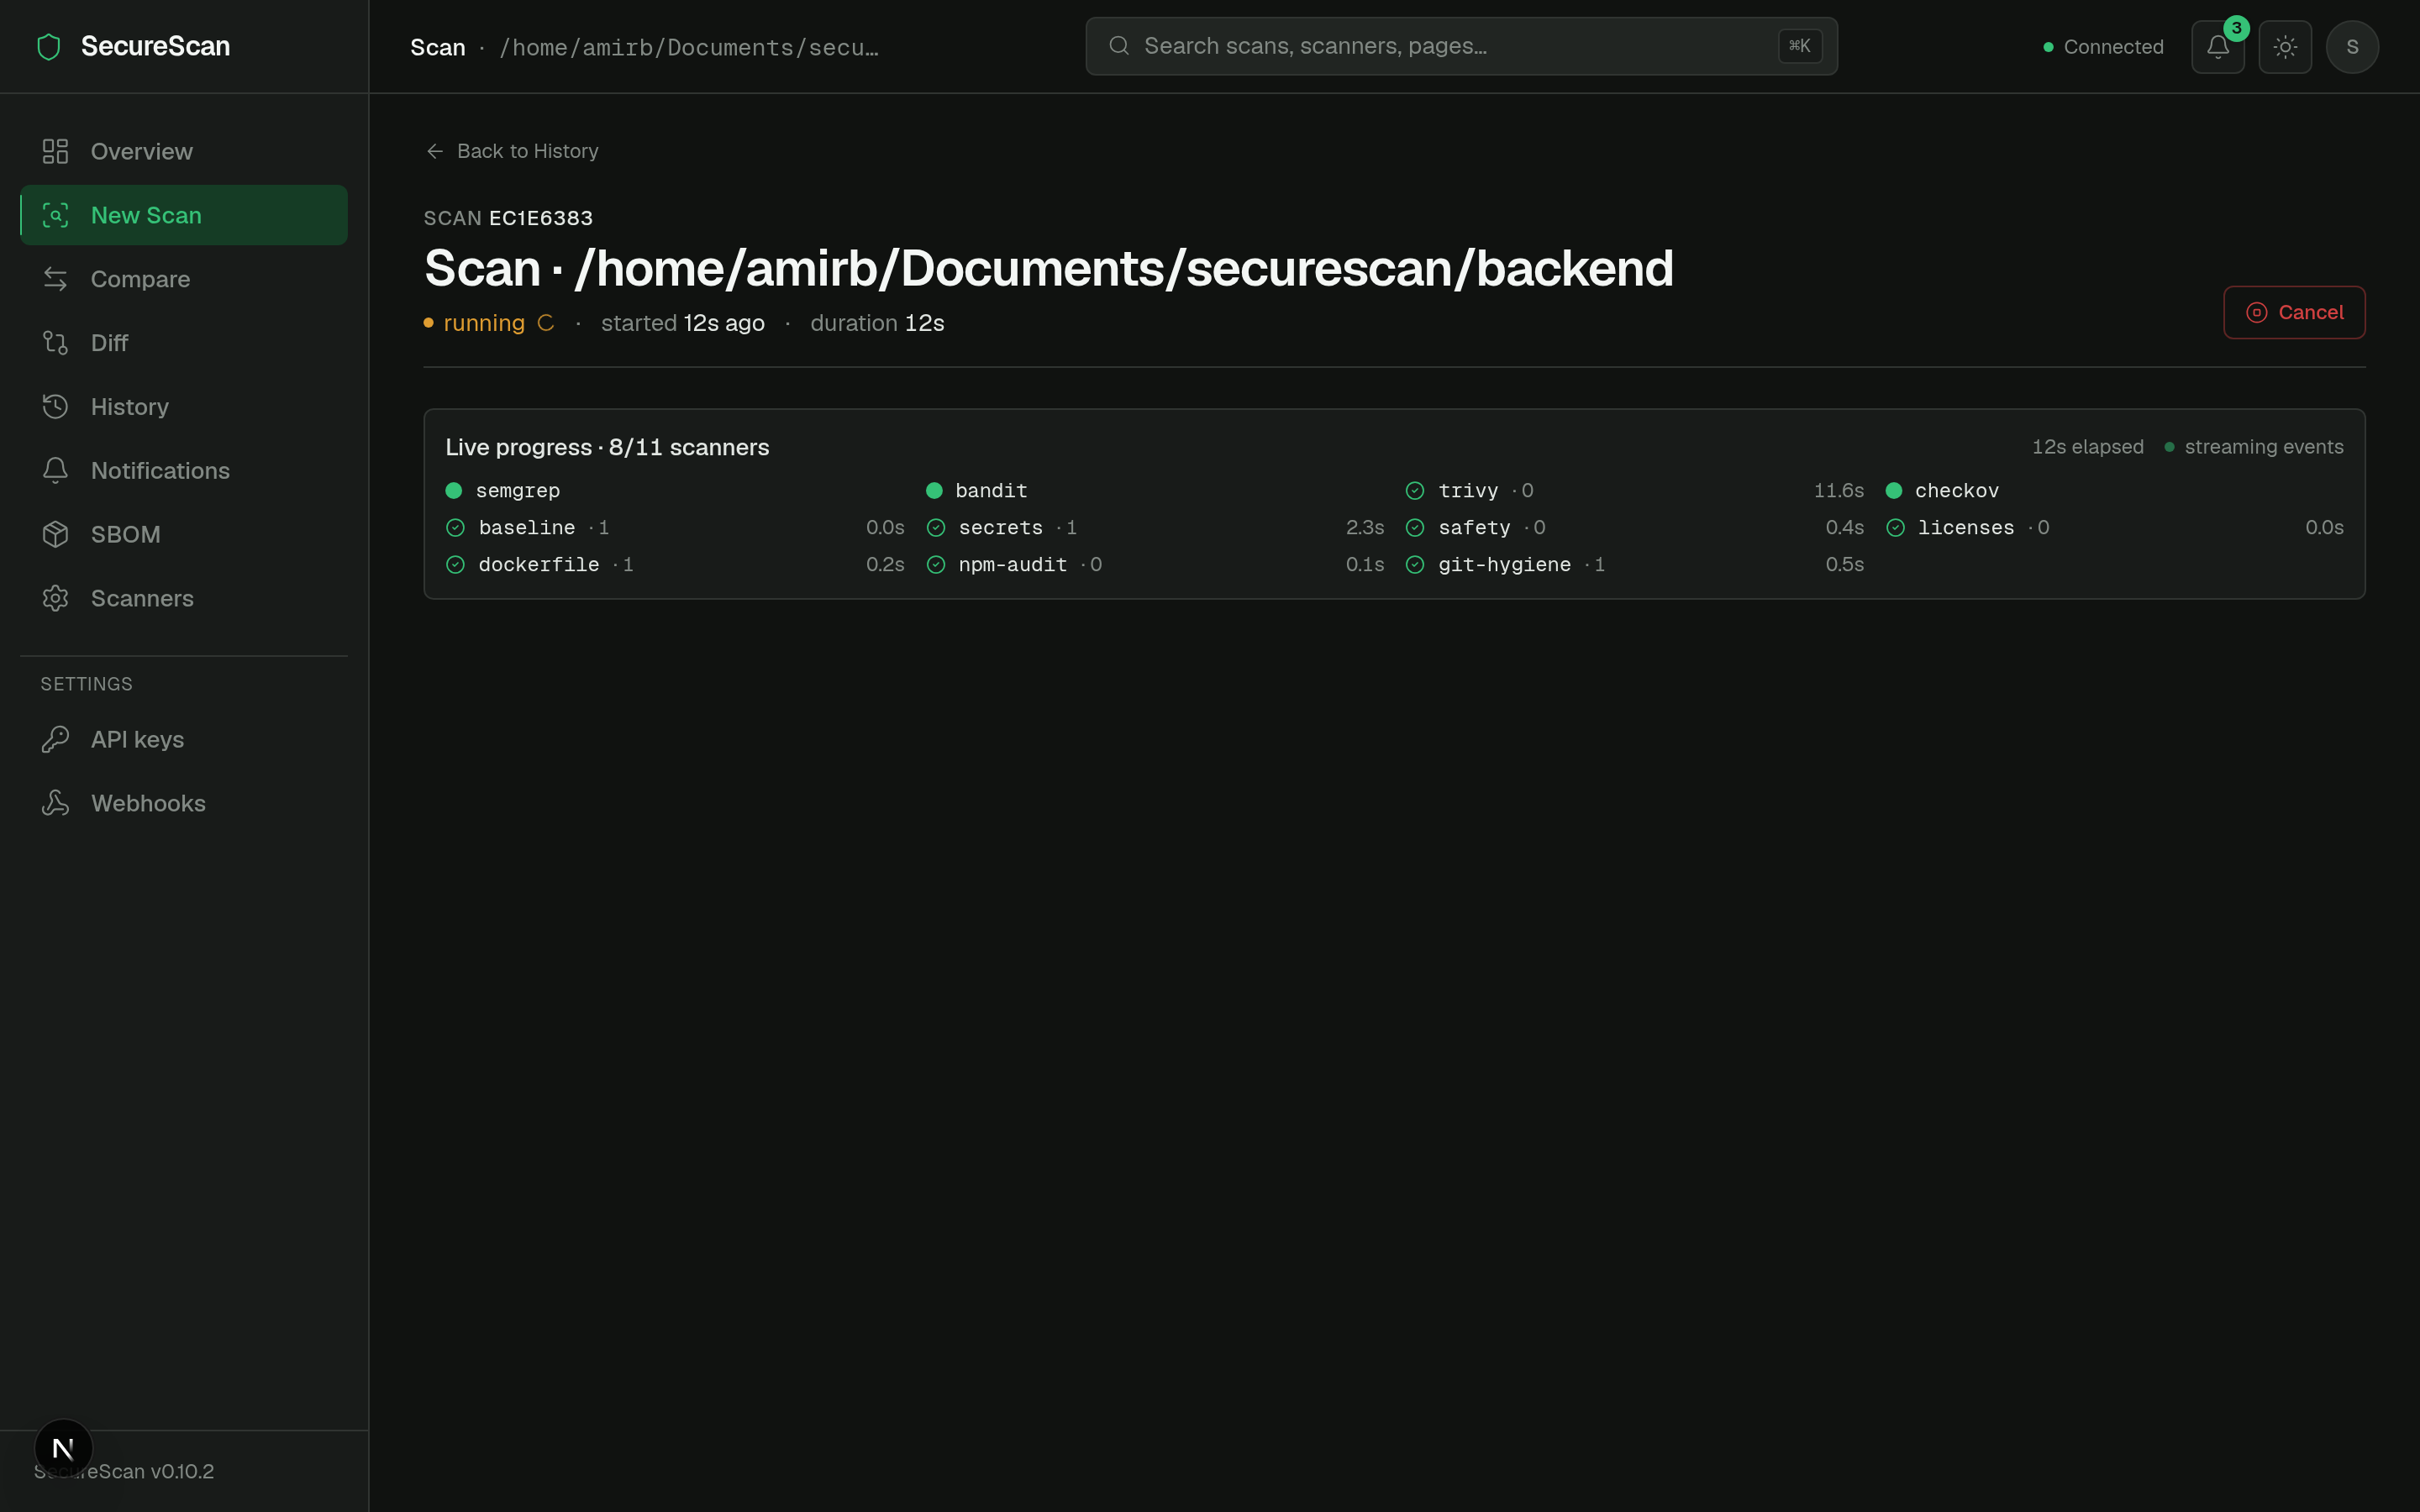
See Real-time scan progress for the SSE flow and Triage workflow for the verdict mechanics.
Source: frontend/src/app/scan/[id]/page.tsx.
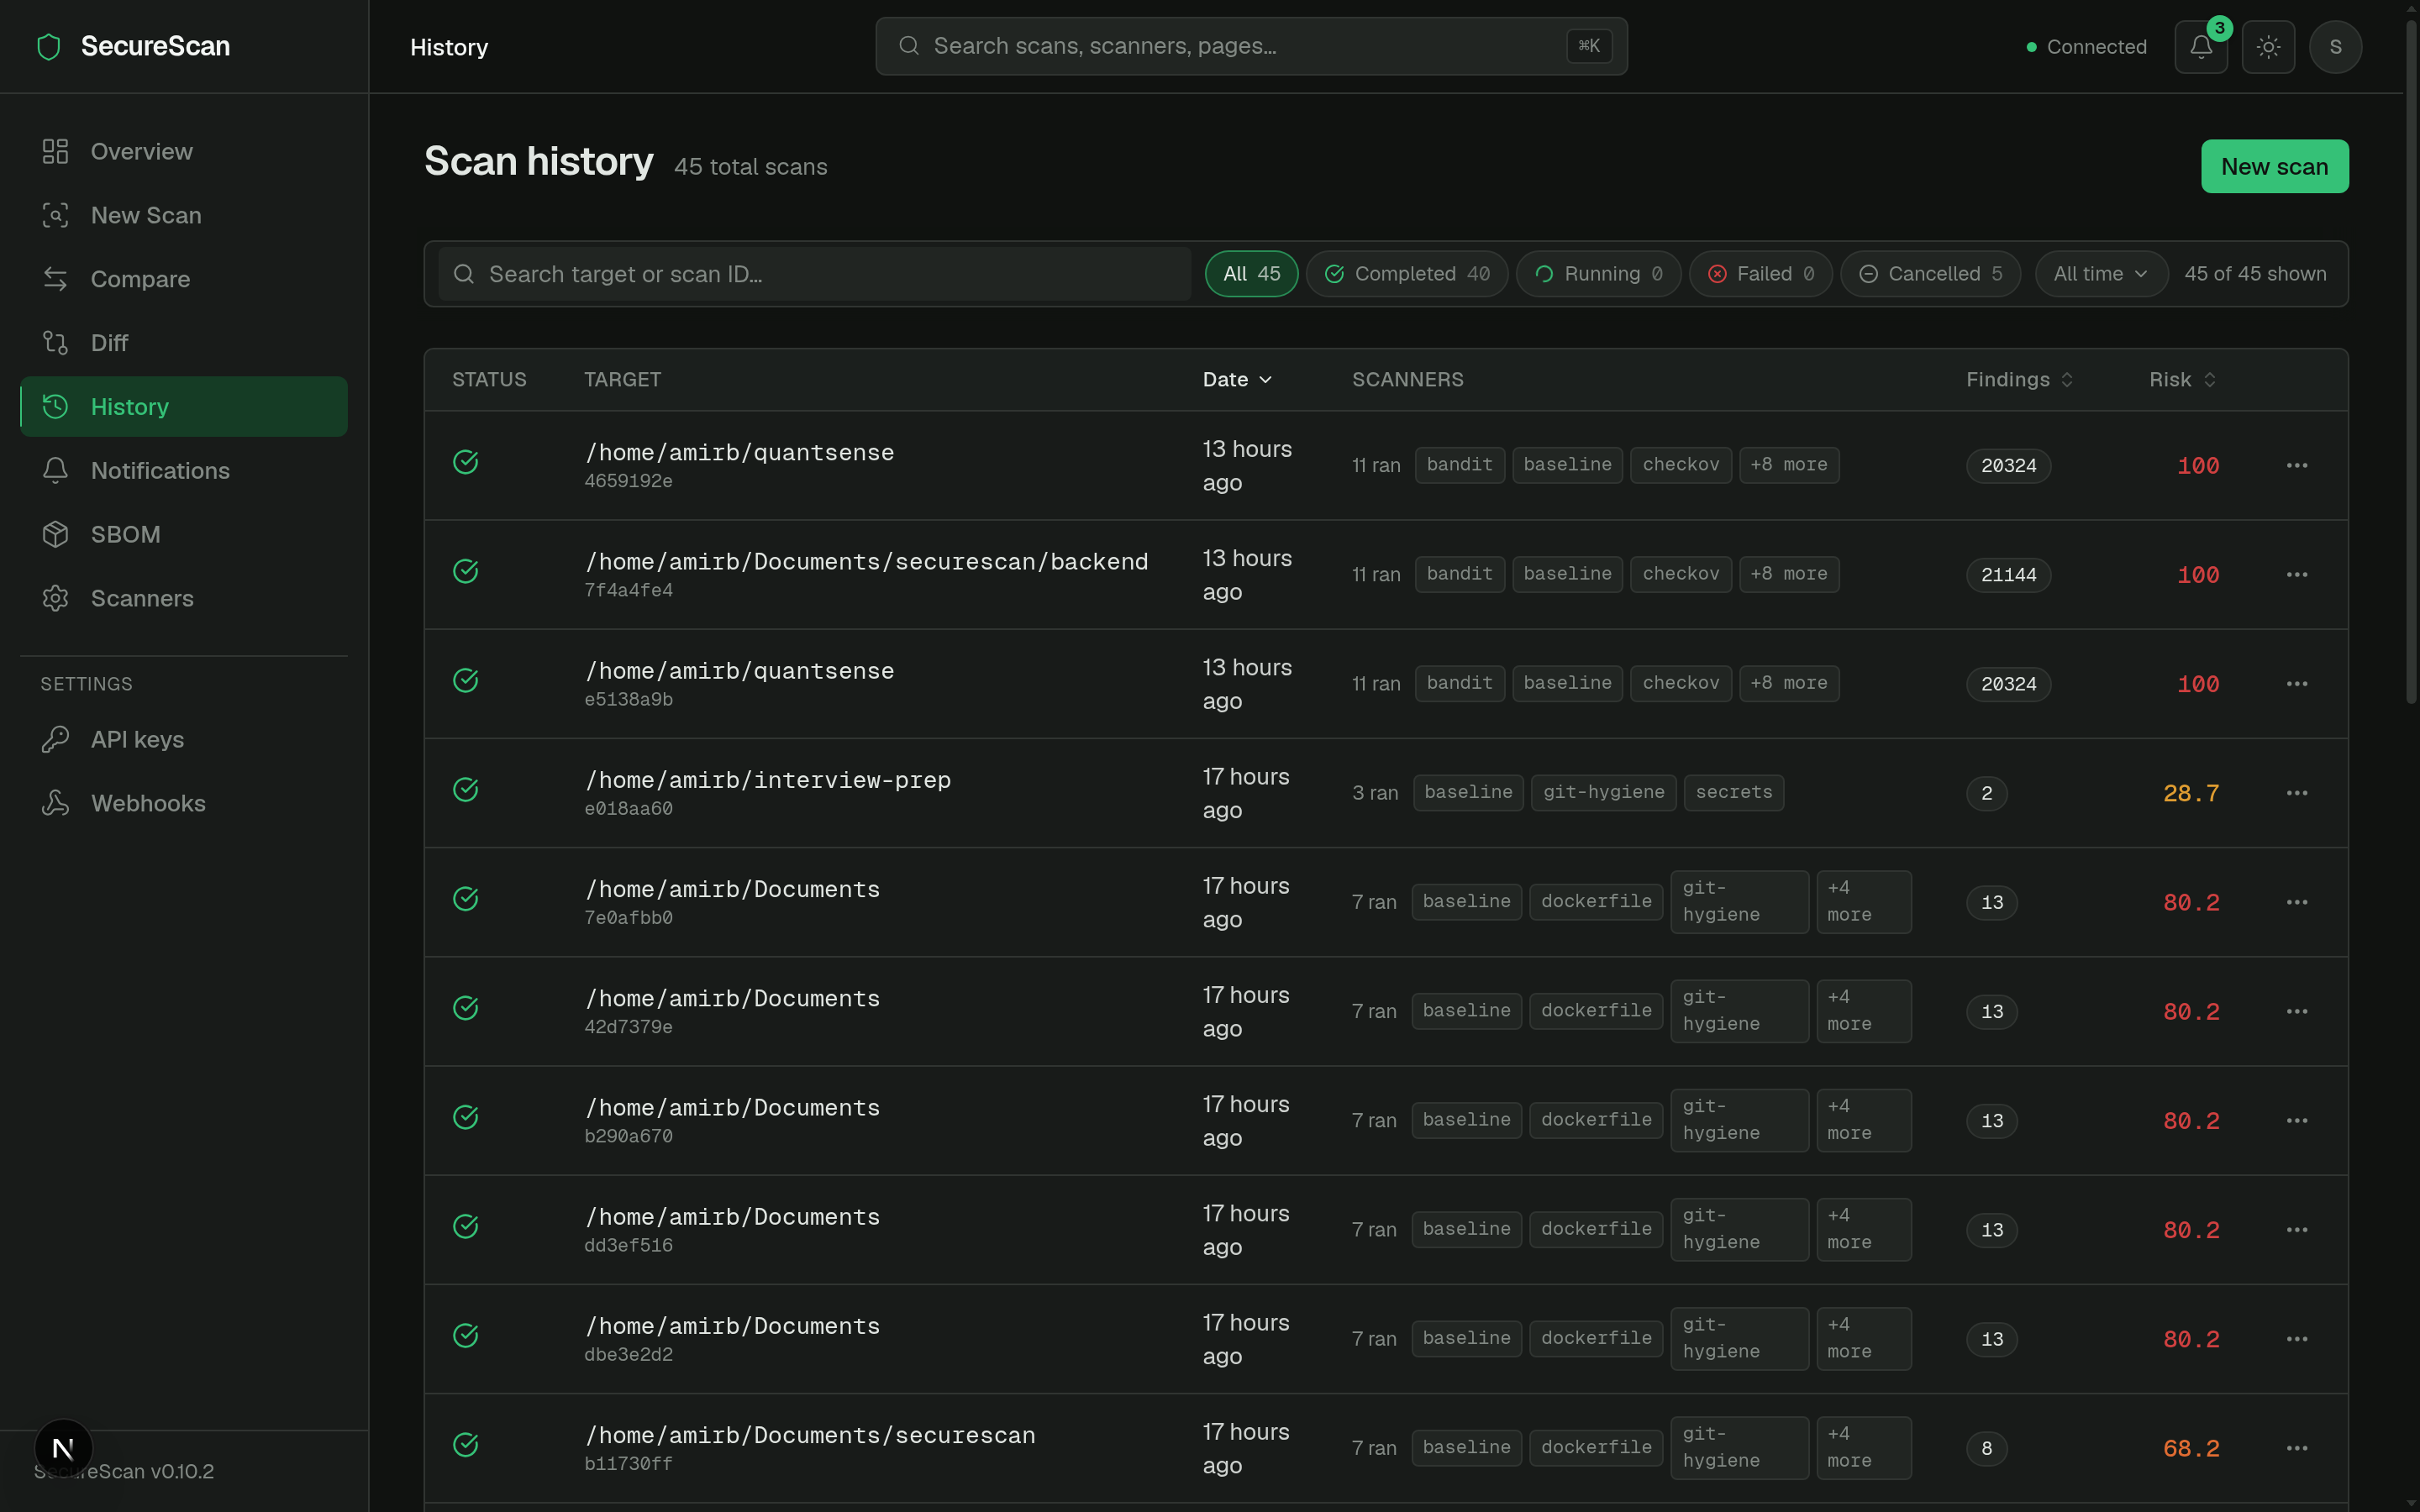
History (/history)
A real data table, not a card grid (the v0.6.0 redesign:
frontend/src/app/history/page.tsx).
- Sortable columns: target, started, duration, status, finding count.
- Status icons inline (●completed / ●running / ●cancelled / ●failed).
- Mono target paths.
- Scanner chip strip per row with overflow indicator (
+3 more). - Kebab action menu per row: re-run, delete, copy link.
- URL-persisted sort + page-size — the URL is the truth, so sharing a filtered view is a copy-paste.
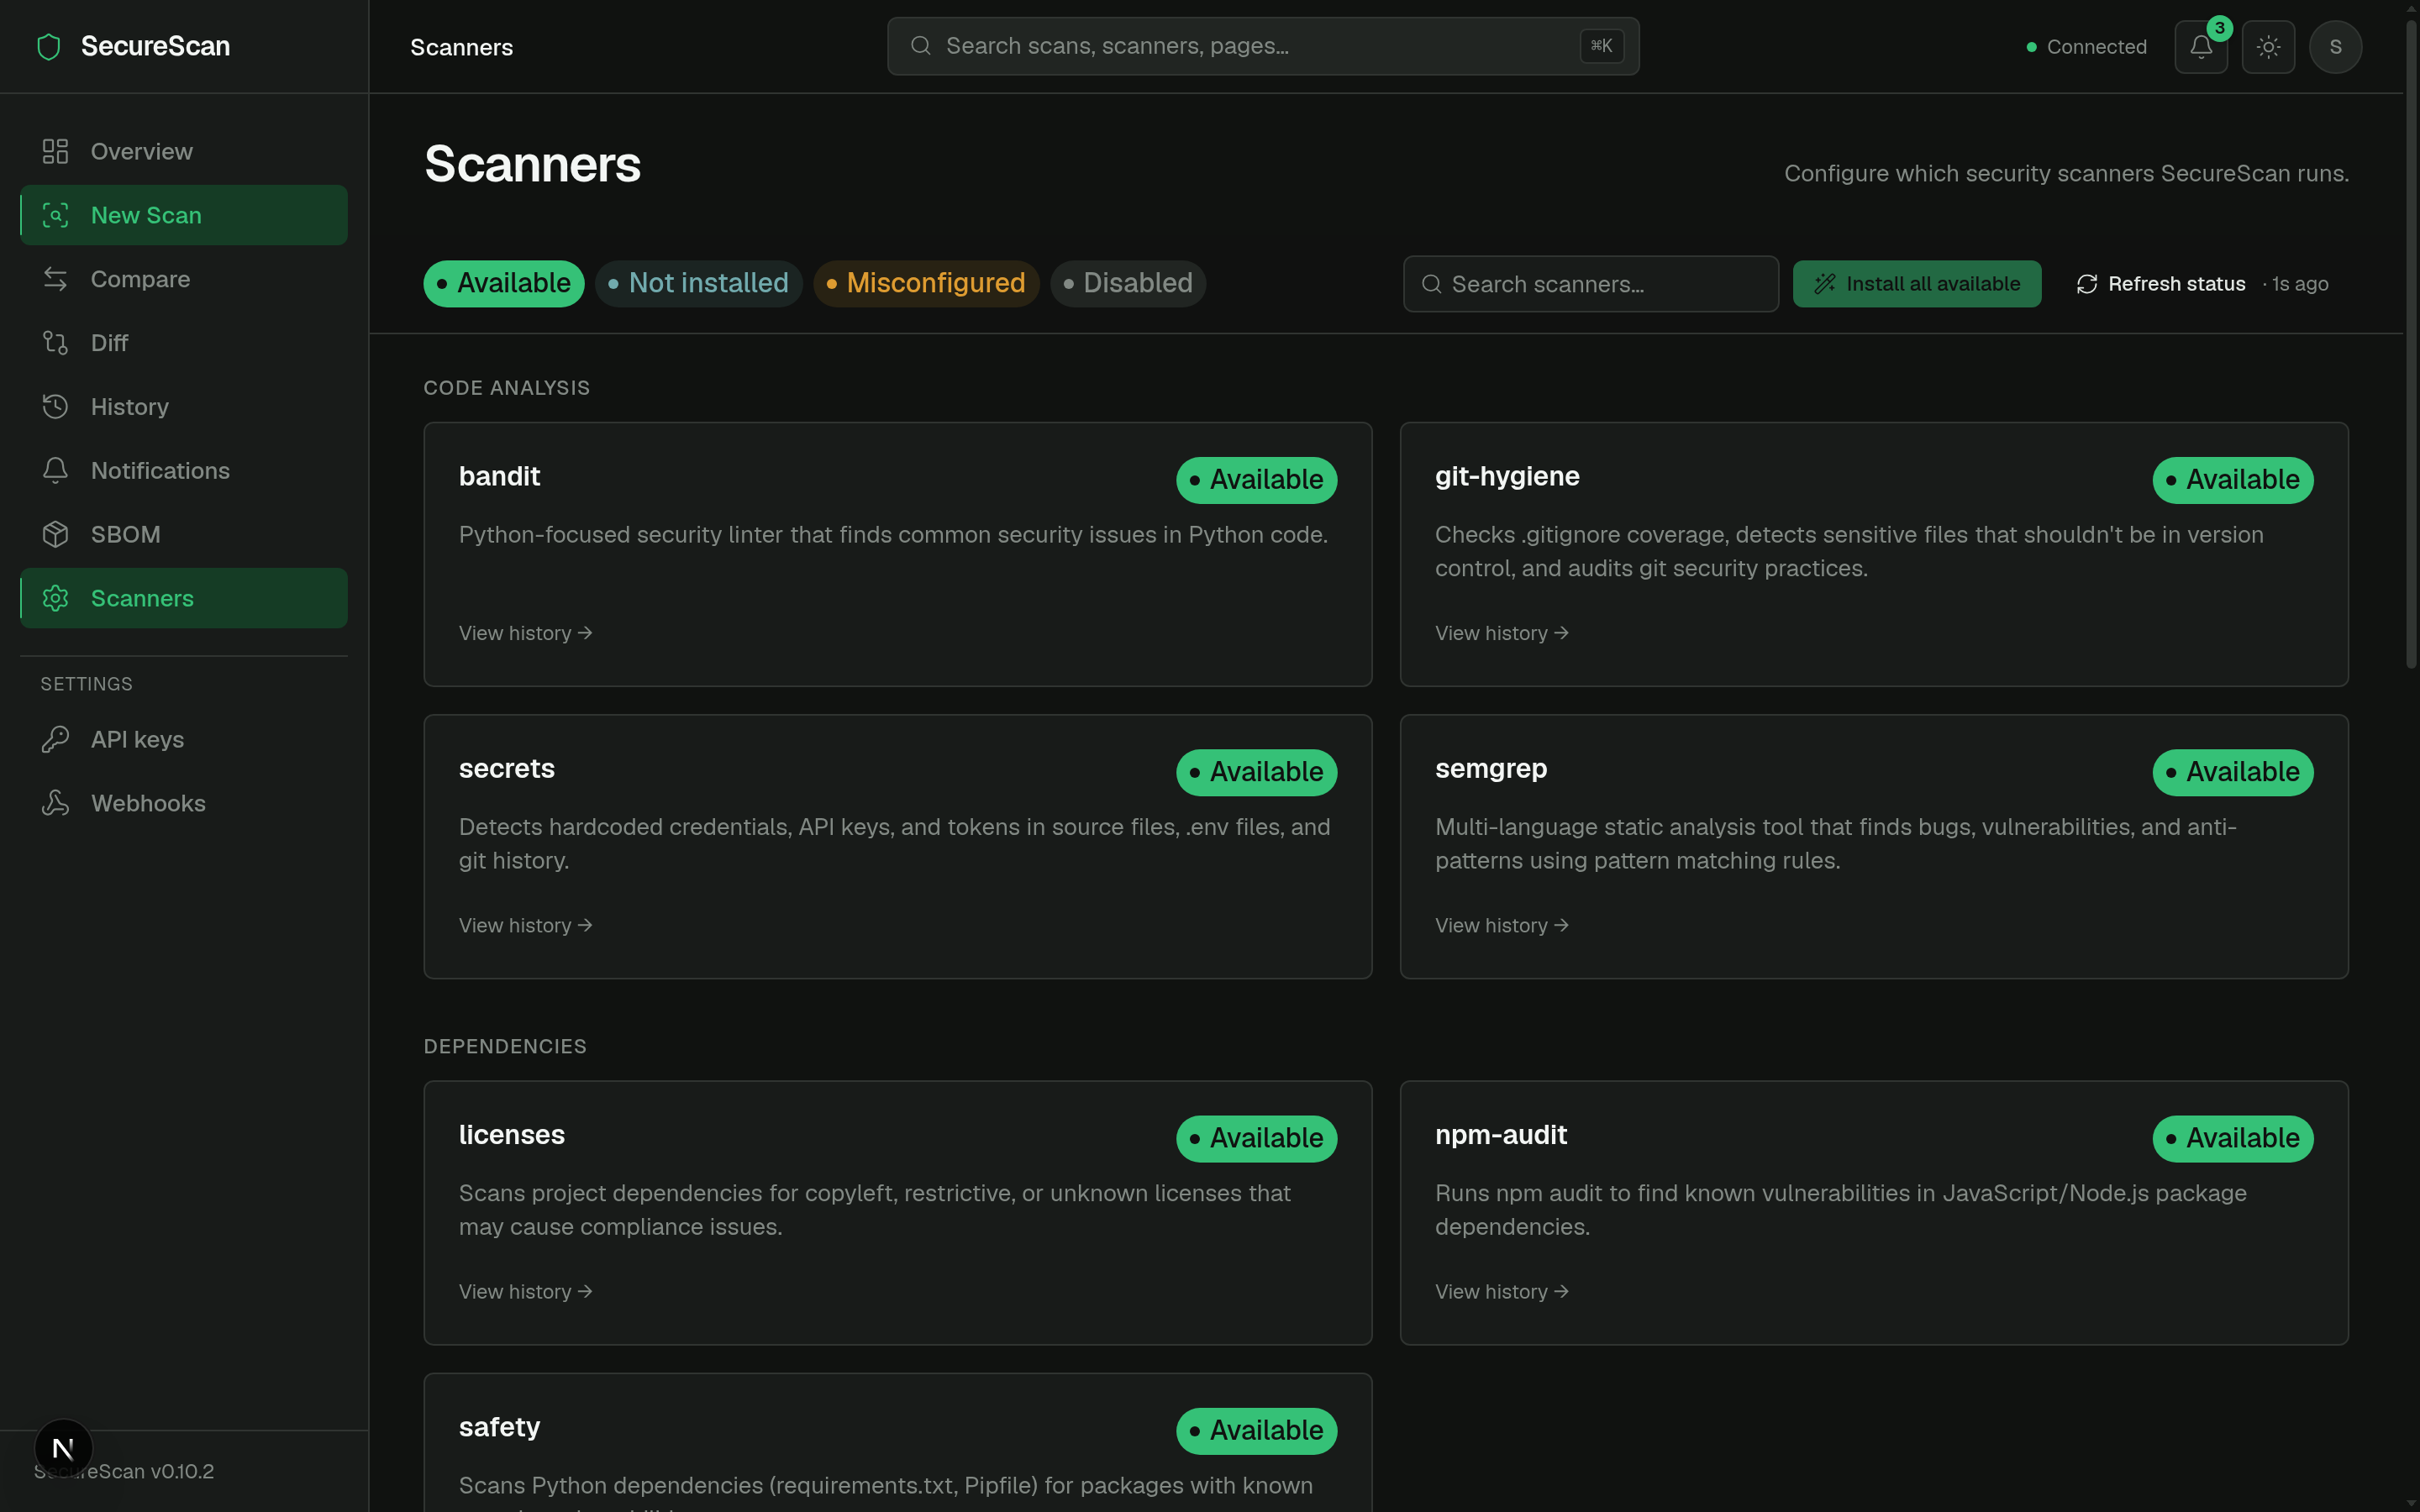
Scanners (/scanners)
Categorized scanner directory.
Code analysis     ●semgrep   ●bandit   ●secrets   ●git-hygiene
Dependencies      ●trivy     ●safety   ●npm-audit ●licenses
Containers / IaC  ●checkov   ●dockerfile
Network           ●nmap
Web (DAST)        ●builtin_dast  ●zap
- Sticky status legend + search at the top.
- Each card: name, category, version (if installed), install hint or
install button (for scanners that can be
pip installed). - "Install all available" bulk action.
Diff (/diff)
PR-style scan-vs-scan comparison (FEAT1 from v0.6.0).
Base [scan picker ▾]  ↔  Head [scan picker ▾]

Summary chips
  ▲ 3 new   ▼ 2 resolved   = 14 unchanged   Risk Δ +12.4

Tabs: [ New (3) ] [ Resolved (2) ] [ Unchanged (14) ]

(table per tab, same columns as scan-detail)
See Diff & compare.
SBOM (/sbom)
Software Bill of Materials viewer (CycloneDX or SPDX).
- Segmented format toggle: CycloneDX / SPDX.
- Scan picker card.
- Component table with ecosystem stats (npm vs PyPI vs Crates …).
See SBOM.
Compare (/compare)
Same shape as /diff but framed for "current scan vs saved baseline"
rather than "scan A vs scan B".
Notifications (/notifications)
Full feed of in-app notifications. See Notifications.
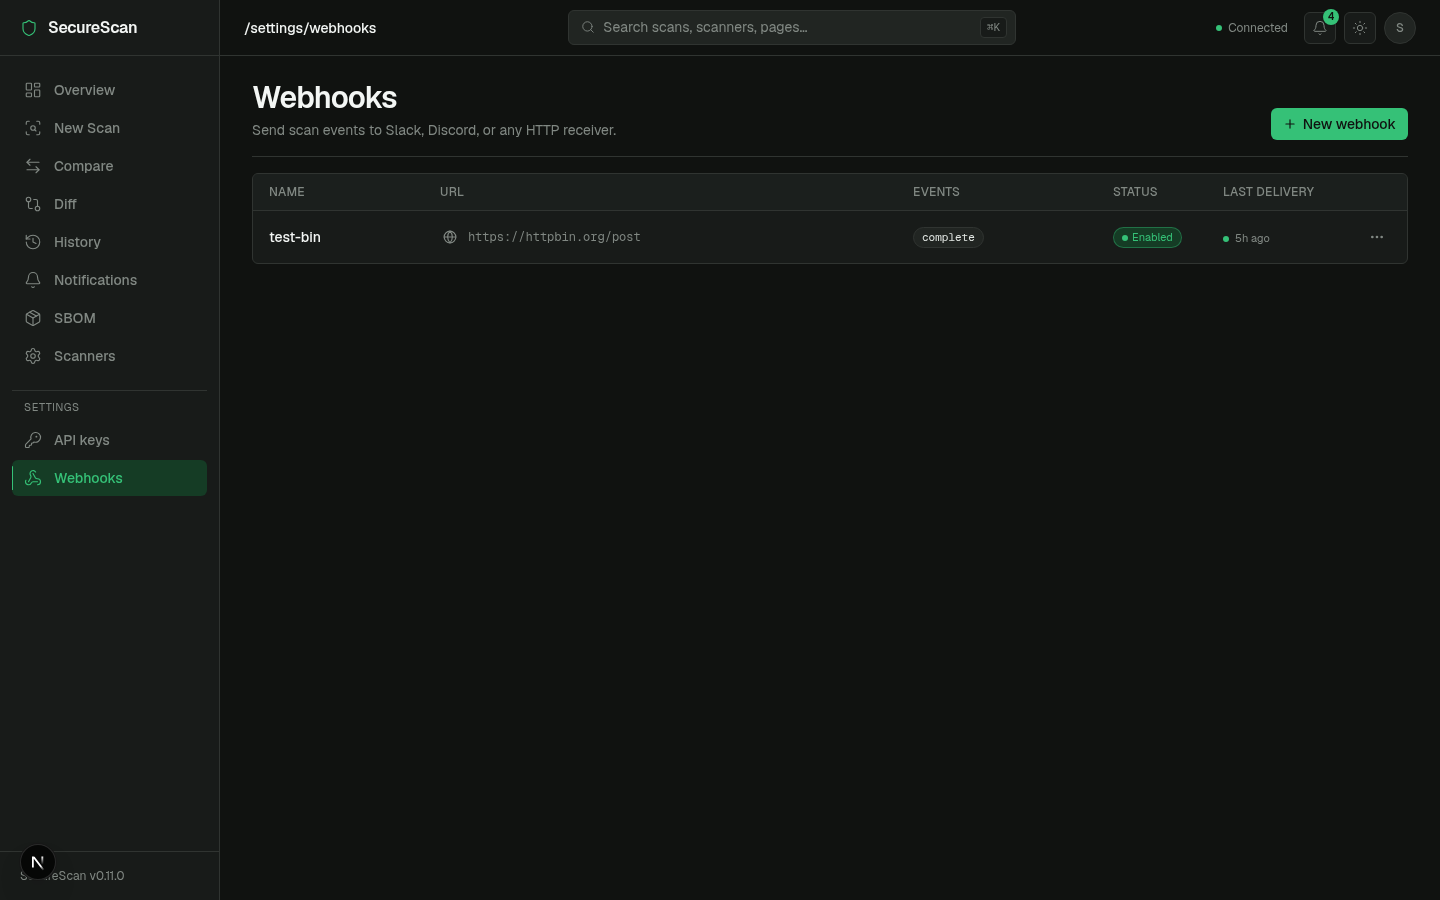
Settings
/settings/keys— list, create, revoke API keys. See API keys./settings/webhooks— list, create, edit, test webhooks. See Webhooks.
Topbar widgets
Notifications bell
Live unread badge, polled every 30s. Click → 360px popover with the 10 most recent (severity dot + title + relative timestamp). See Notifications.
API health indicator
Pings GET /ready every ~10s. Color codes:
- ● green — ready (200).
- ● amber — degraded (200 with one of the checks failing — rare).
- ● red — unreachable / 503.
Hover for the underlying check breakdown.
Theme toggle
next-themes integration. Dark default; persists to localStorage and
to a cookie so SSR doesn't flash.
Command palette (⌘K)
Mounted at app root. Searches: pages, recent scans, scanners. Keyboard driven. The primary nav affordance for power users.
Auth & the dashboard
The frontend client (frontend/src/lib/api.ts) injects
X-API-Key: <NEXT_PUBLIC_SECURESCAN_API_KEY> on every request when
the env var is set at build time. For DB-backed keys (v0.8.0+), the
flow is the same — set the key value as NEXT_PUBLIC_SECURESCAN_API_KEY.
For SSE streams (/scans/{id}/events), the dashboard exchanges that
key for a short-lived event token first — see
SSE event tokens.
NEXT_PUBLIC_* env vars are baked into the build and shipped to the
browser. Do not put a high-trust admin key there; use a read-scope
key. For dashboards exposed beyond your laptop, terminate the dashboard
behind your own auth (SSO, mTLS) and treat its key as a service
identity, not a user identity.
Next
- Real-time scan progress — the SSE flow under the hood.
- Notifications — the bell icon's data path.
- Webhooks — outbound delivery of the same events.
- API keys —
/settings/keysin detail.